Kensington & Chelsea house prices: what buyers actually paid in 2025
Britain's most-searched prime market is also its most misunderstood: asking prices and “average” headlines hide a decade-long repricing. Here is what completed sales in SW3, SW5, SW7, SW10, W8, W10, W11 and W14 actually recorded.
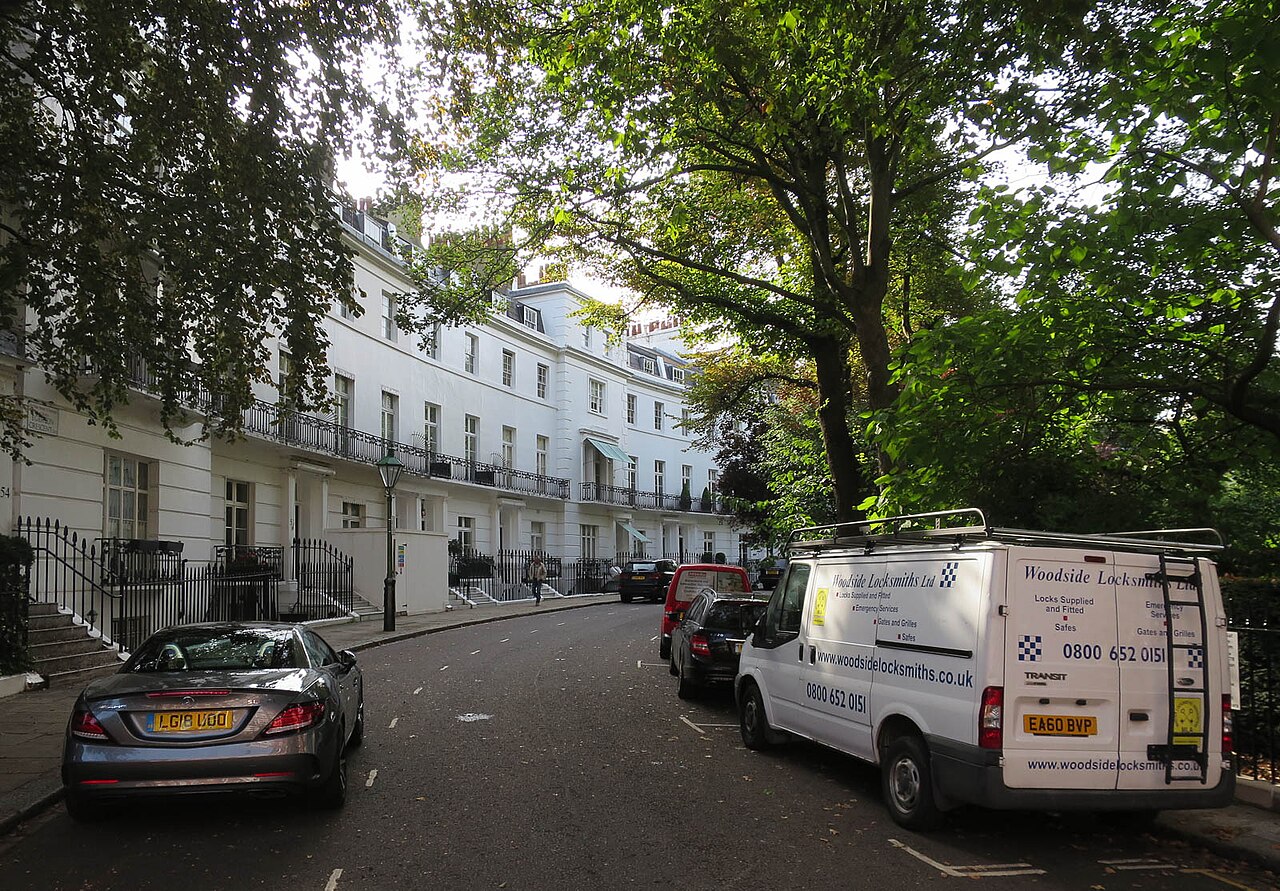

No part of the UK market gets talked about — or searched for — like Kensington & Chelsea. It is also where headline averages mislead most: a handful of £20M sales can move a borough mean by six figures. HomesIndex works in medians of completed sales, so the numbers below are what the middle actually paid.
The typical sale: £1.07M
Across the borough's eight postcode districts, the typical recorded sale in 2025 was £1,065,643 — down 7.0% on 2024, and 16.3% below the 2022 peak of £1,272,958. Prime central London has been quietly repricing for years while the rest of the country caught up; the record shows it plainly.
District by district
“Kensington & Chelsea” is really eight markets. W8 led 2025 at a median £1,562,500; W14 closed it at £605,400 — a 2.6× spread inside one borough.
How thin prime London trading has become
The starker chart is volume. The eight districts recorded 2,505 sales in 2025, against 3,634 in 2014 — stamp duty at the top end, absent overseas demand, and owners who simply won't sell into a falling market. Thin trading is why single streets here can print wildly different “trends” month to month.
See every sale on the map
The map below shades each district by its median; click any shape for its price history, or zoom past street level to the individual sold homes.
SW3 prices · SW5 prices · SW7 prices · SW10 prices · W8 prices · W10 prices · W11 prices · W14 prices
A note on the data
Medians of completed sales recorded by HM Land Registry (Crown copyright), geocoded to the property. The borough figure is the sales-weighted average of the eight districts' medians. The most recent year in the record is partial while registrations arrive, so 2025 is the latest complete year shown.