The HomesIndex blog
Data stories from the sold-price record. Every number below is computed from HM Land Registry's full record of completed sales, refreshed with the monthly data release, never hand-typed. Every story exists because real people are searching for the answer.
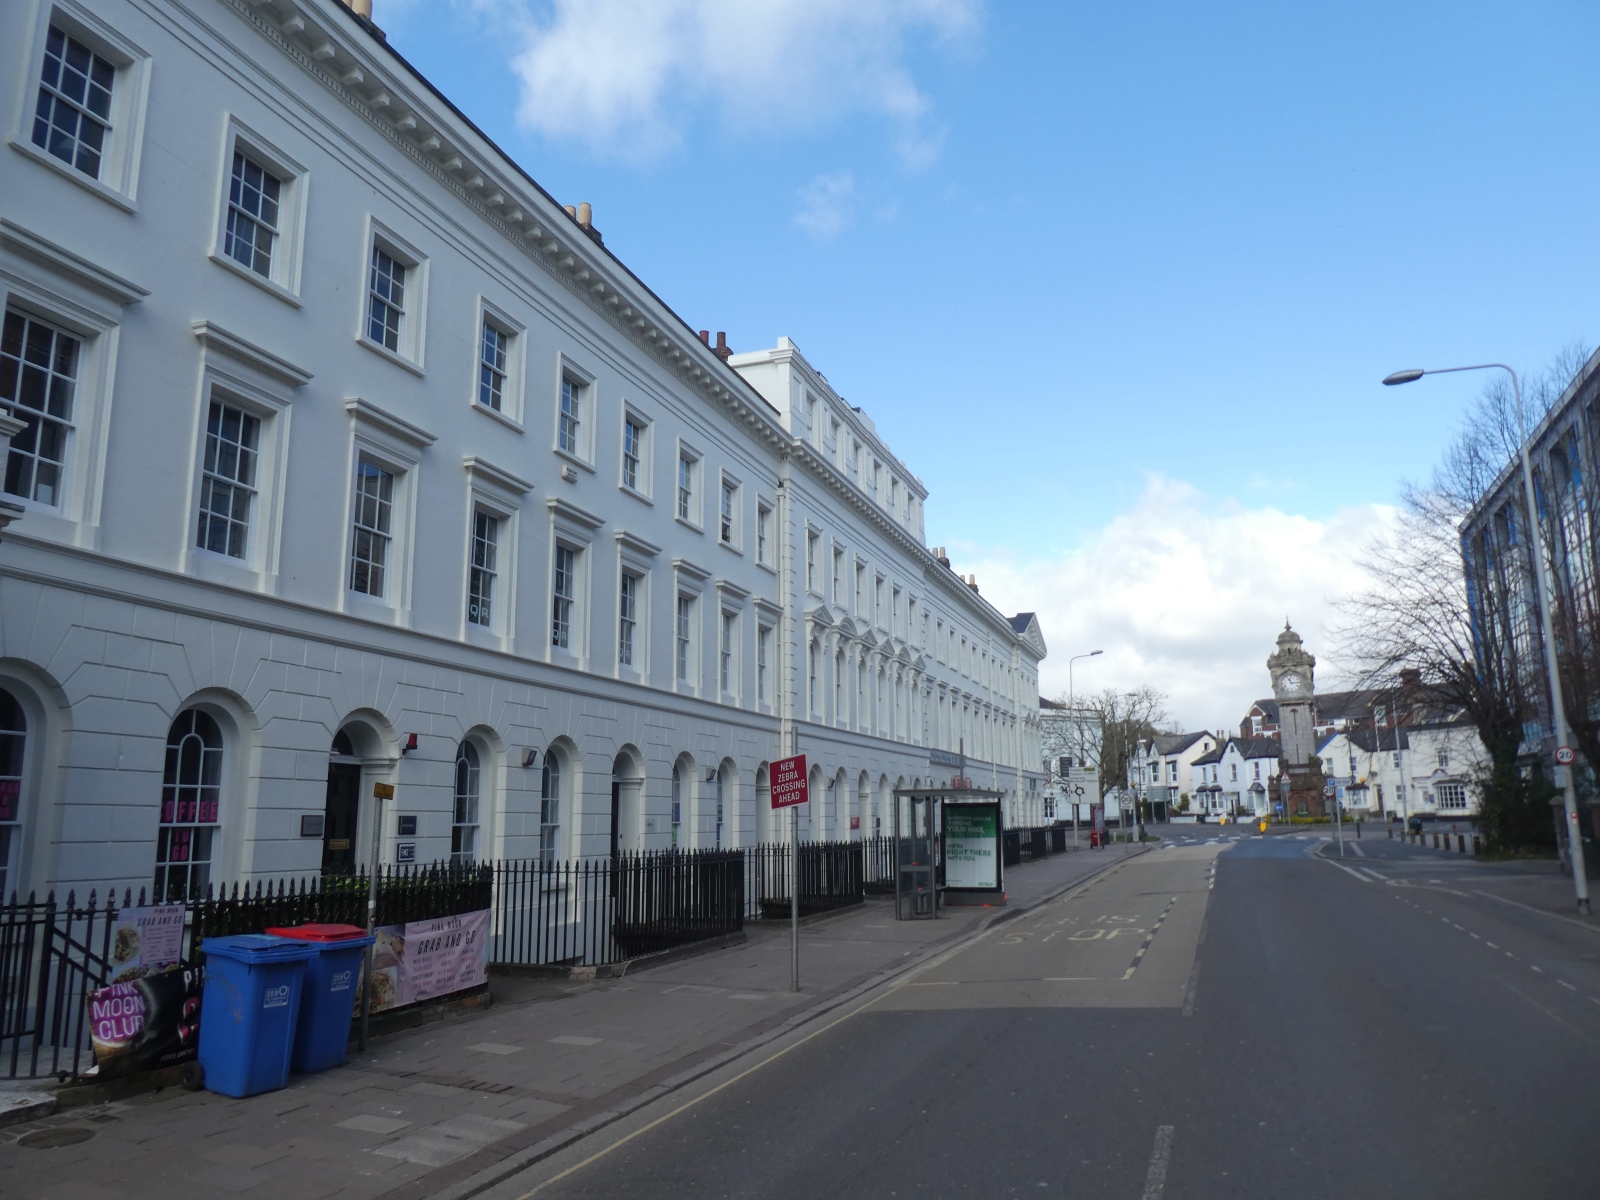
Where £300k actually gets you, on the 2025 sold-price record
In 2025 the typical home sold for £300,000 or less in 52% of postcode districts, against 78% a decade earlier. The share has barely moved since 2022.
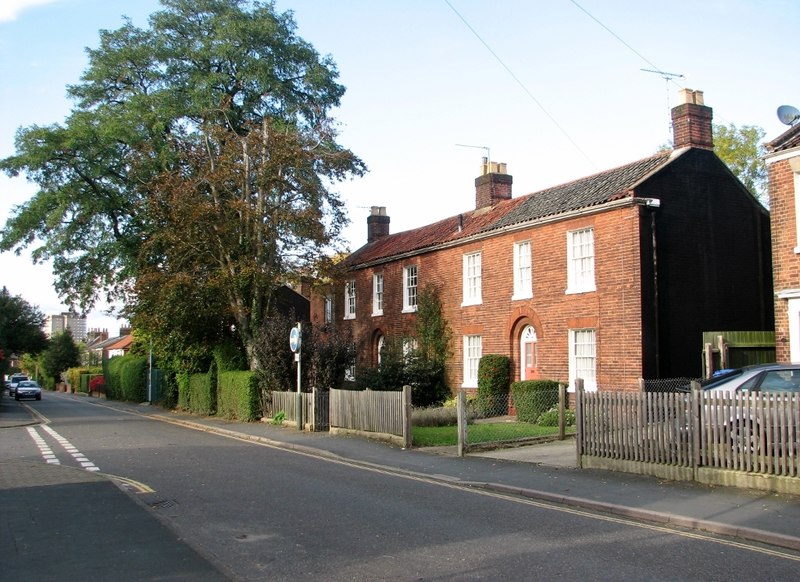
House prices per square metre: the cheapest and most expensive places in England & Wales
A square metre of home costs £940 in Middlesbrough (TS1) and £20,870 in London (SW1X), a gap of 22 times. Almost all of the price difference between districts is the rate, not the size of the homes.
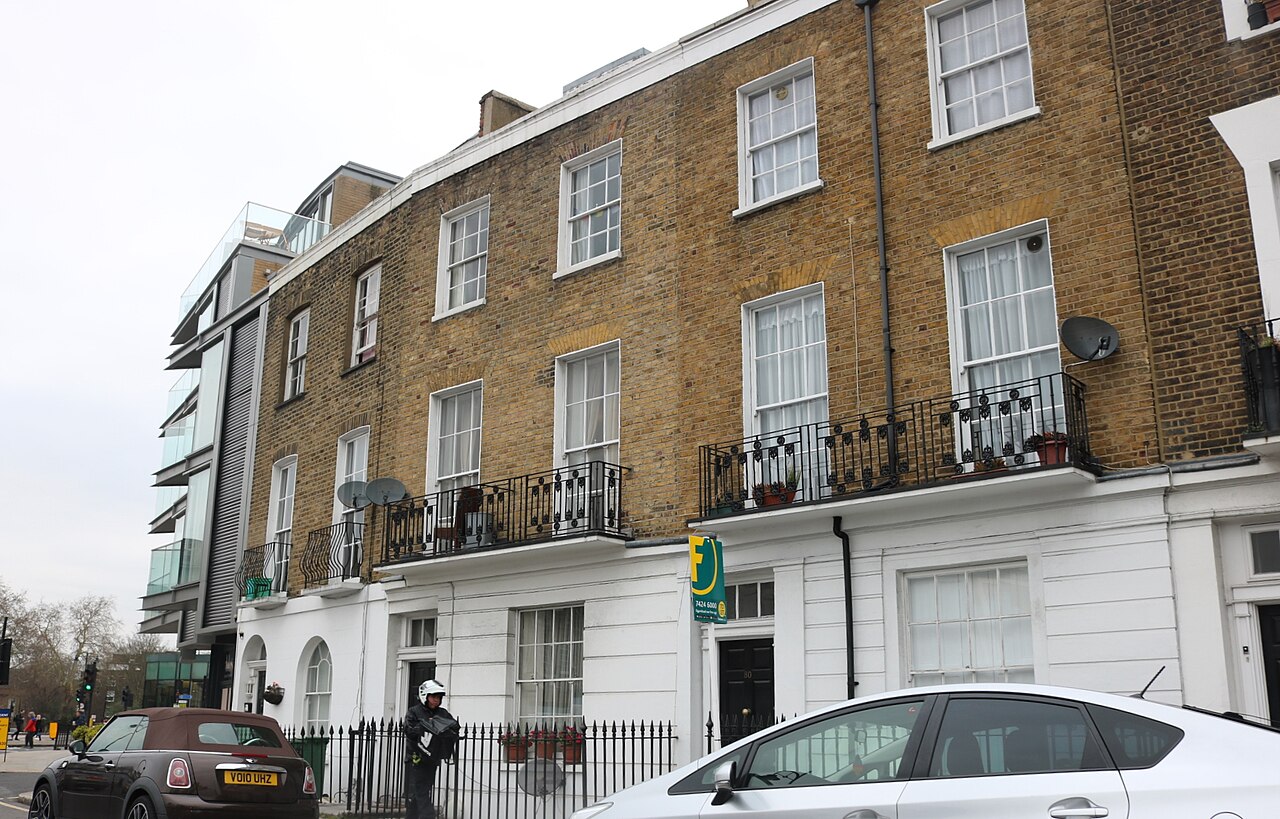
London house price trends: every postcode, on the sold record
Adjusted for inflation, every one of 128 London postcode districts sit below their own best year. The typical one is 24% down on a peak it reached in 2019, and the most expensive districts have fallen furthest.
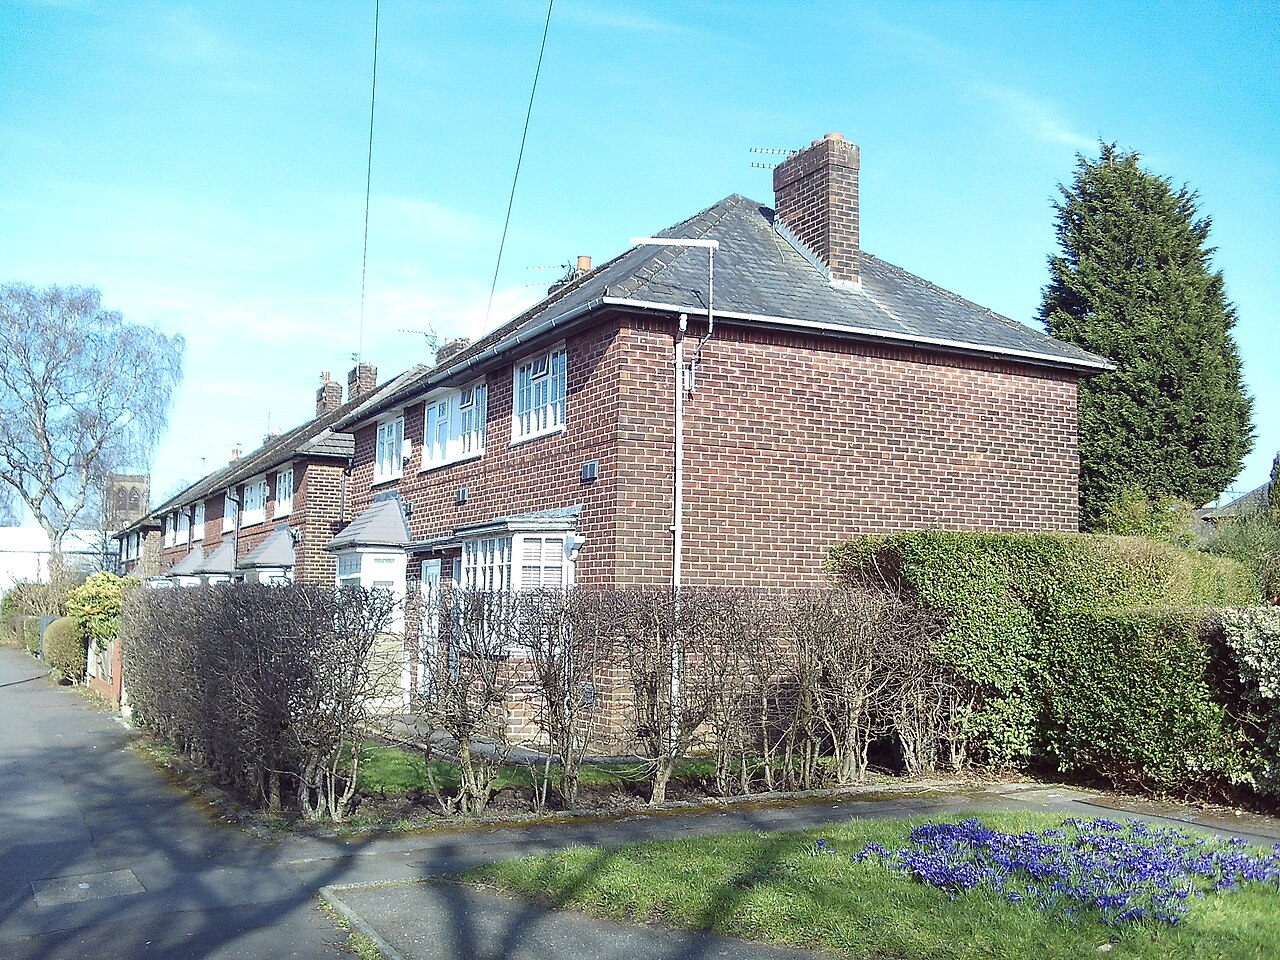
Have house prices increased since 2020?
Cash prices are up 14% since 2020 and 100 of 104 postcode areas rose. Adjusted for inflation the typical home is worth 10% less, and only 11 areas are ahead.
City centres left behind
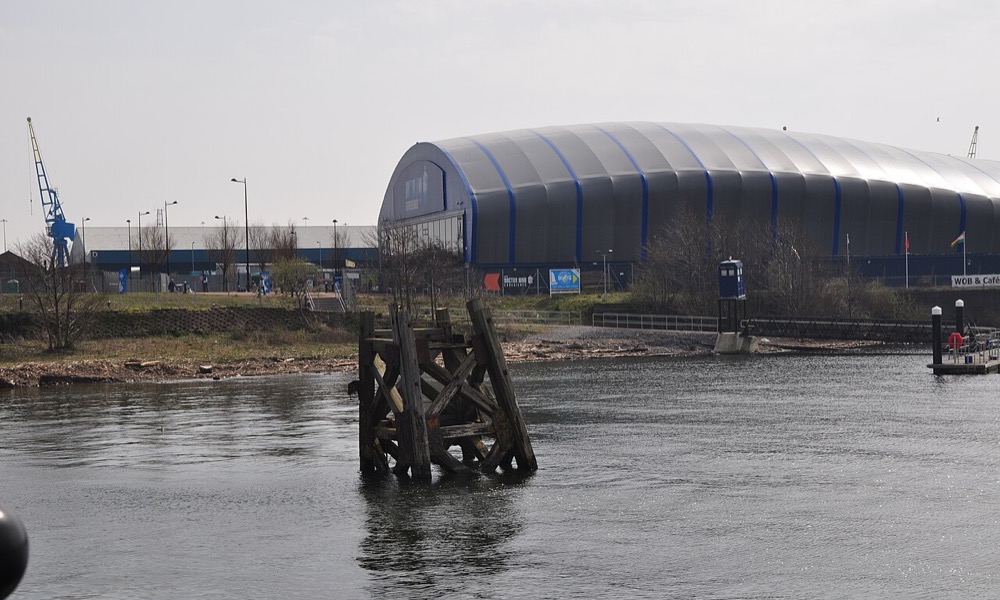
Over ten years the typical home in England and Wales rose +38.7% in cash and +0.5% after inflation. The neighbourhoods that fell furthest behind their own cities are the city centres: Southampton, Cardiff Bay and Bristol are 26 to 36 points behind, and the reason is that they are built of flats.
Flat prices against house prices: the widest gap on the 31-year record
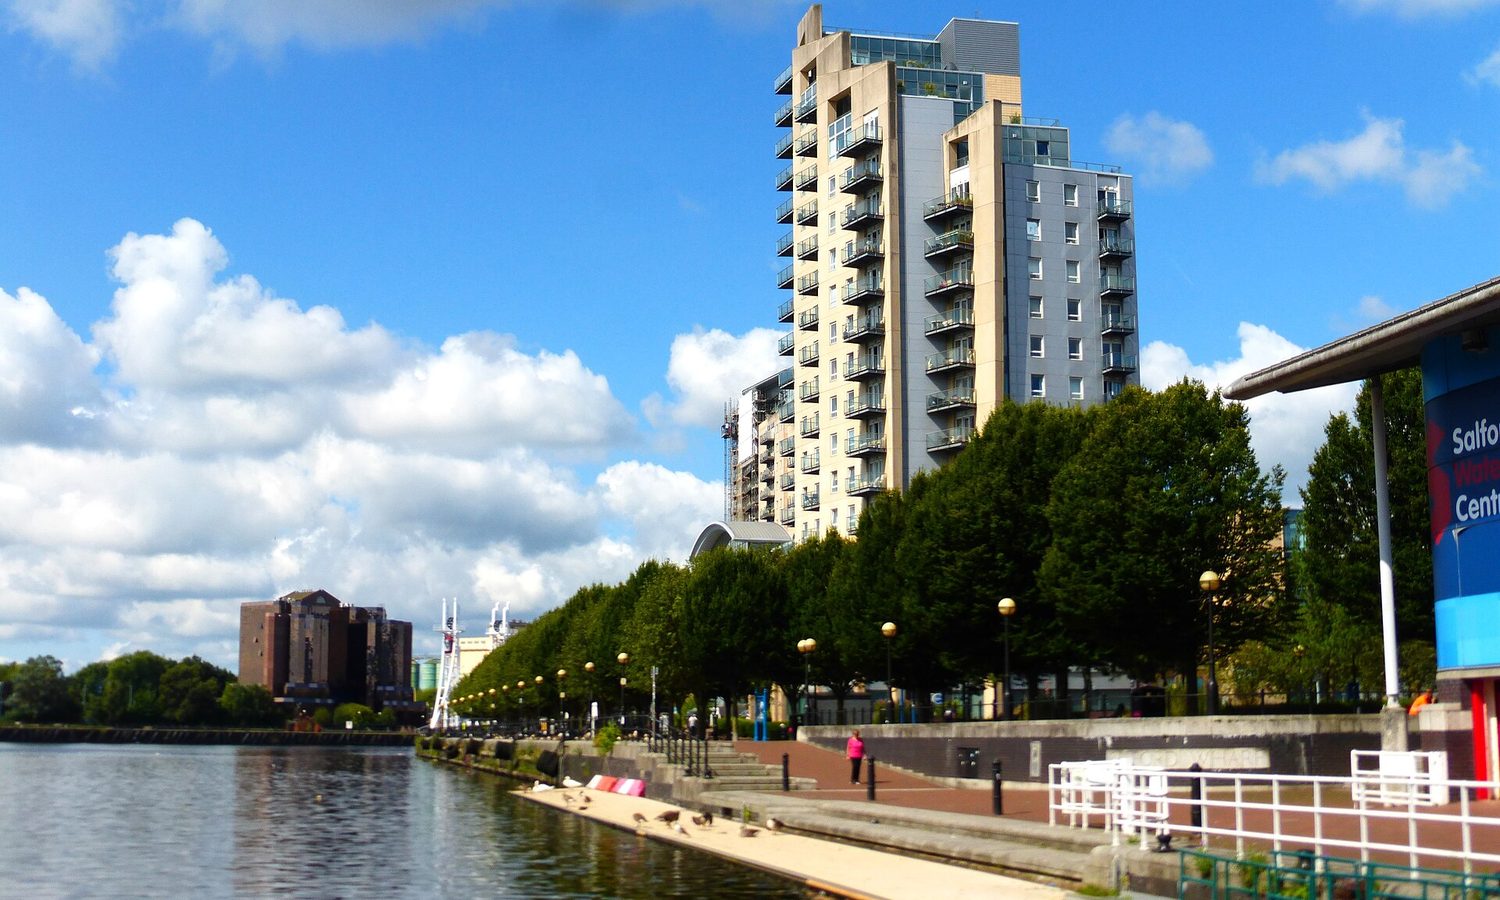
In 2025 the typical flat sold below the typical terraced house in every one of 101 postcode areas. In 2005, 39 areas priced flats higher.
Looking for a specific place instead? Every postcode area and district has a standing local market report, and the average prices map goes from national shading down to individual sold homes.